Most JSONB indexes I inherit look the same:
CREATE INDEX ON events USING gin (payload);
That line came from a Stack Overflow answer, it worked, and nobody looked at it again. It's usually the wrong index — typically twice the size it needs to be, slower to build, slower to search, and quietly costing you two features you didn't notice you'd lost.
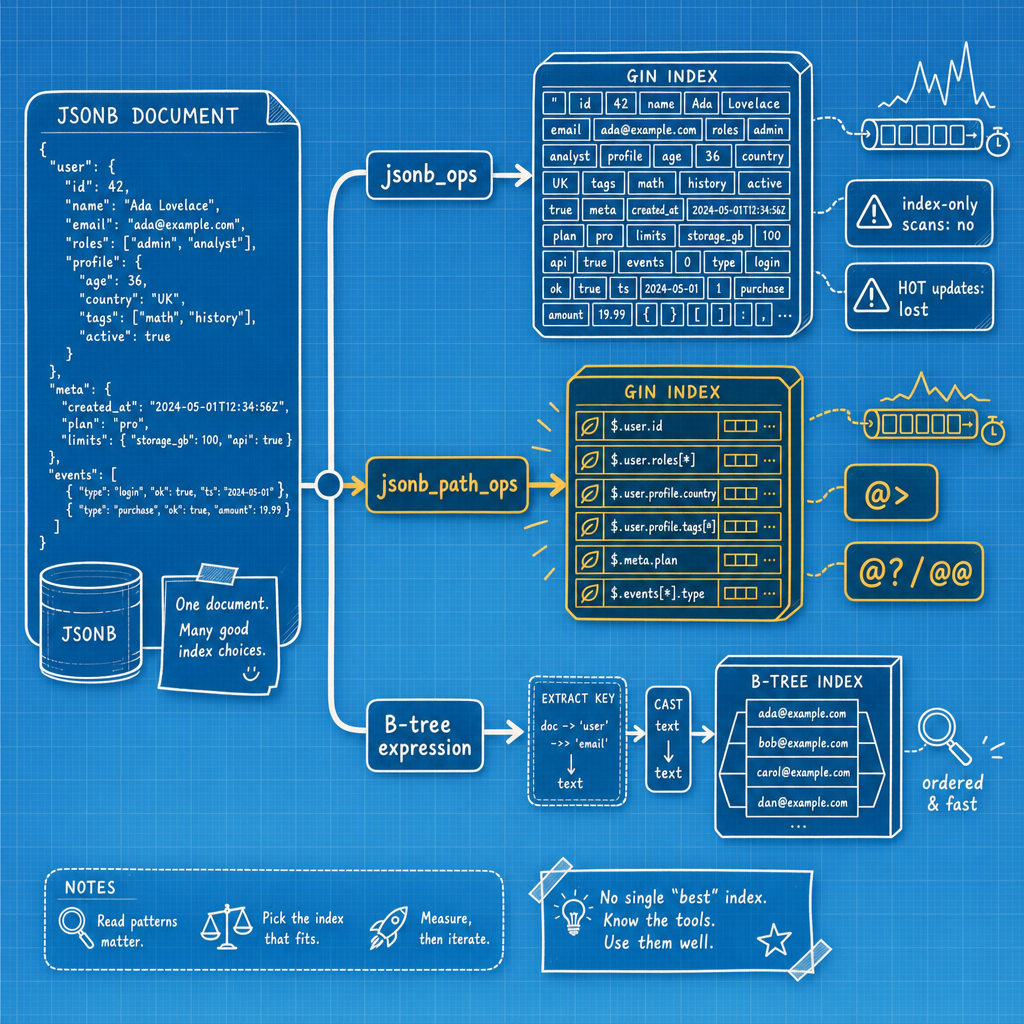
Short version: if your predicates are containment (@>) or jsonpath (@?, @@), build USING gin (payload jsonb_path_ops). If you need key-existence checks (?, ?|, ?&), you're stuck with the default jsonb_ops. If you always filter on one specific key, skip GIN entirely and use a B-tree on the extracted expression. The rest of this is the reasoning and the numbers behind that.
The decision you're actually making
You are choosing between three things, and the choice is driven entirely by which operators your queries use.
If your predicates are containment (@>) or jsonpath (@?, @@), use USING gin (payload jsonb_path_ops). It is usually much smaller than the default and handles the "this key is in every row" case far better. If you need key-existence checks (?, ?|, ?&), you have no choice: those operators only work with the default jsonb_ops. And if you're always filtering on one specific key, with equality, a range, an ORDER BY, or a uniqueness requirement, don't use GIN at all. Build a B-tree on the extracted expression.
Most real schemas end up needing all three, on different indexes, for different queries. Picking one and hoping it covers everything is how you end up with a multi-gigabyte index serving a table half its size.
Opinion, clearly labelled as one: in application schemas I have never needed jsonb_ops. Key-existence queries almost always turn out to be a modelling problem in disguise — the exception is genuinely dynamic key lookups, feature flags, arbitrary tag sets, where ?| and ?& really are the query shape. But "almost always" isn't "always," so read the operator table before you take my word for it.
A test table you can paste in
Every number below came from a laptop running this. Yours will differ; the ratios shouldn't.
CREATE TABLE events (
  id           bigserial   PRIMARY KEY,
  tenant_id    int         NOT NULL,
  created_at   timestamptz NOT NULL,
  payload      jsonb       NOT NULL
);

INSERT INTO events (tenant_id, created_at, payload)
SELECT
  1 + (g % 50),
  now() - ((g % 2592000) * interval '1 second'),
  jsonb_build_object(
    'status',  (ARRAY['pending','active','failed','archived'])[1 + (g % 4)],
    'kind',    (ARRAY['login','purchase','refund','page_view','export'])[1 + (g % 5)],
    'amount',  round((g % 10000)::numeric / 100, 2),
    'tags',    to_jsonb(ARRAY[
                 (ARRAY['mobile','web','api'])[1 + (g % 3)],
                 (ARRAY['eu','us','apac'])[1 + (g % 3)]
               ]),
    'actor',   jsonb_build_object(
                 'id',     1 + (g % 100000),
                 'role',   (ARRAY['admin','member','guest'])[1 + (g % 3)],
                 'region', (ARRAY['eu-west','us-east','ap-south'])[1 + (g % 3)]
               )
  )
FROM generate_series(1, 2000000) AS g;

VACUUM ANALYZE events;
Two million rows, a realistic nested shape: flat scalars, a tags array, a nested actor object.
Now the two candidates, side by side:
-- the default everybody types
CREATE INDEX events_payload_gin_ops
  ON events USING gin (payload);

-- the one you probably want
CREATE INDEX events_payload_gin_path
  ON events USING gin (payload jsonb_path_ops);
Before either build, raise maintenance_work_mem. GIN builds honour it and a large build gets materially faster with more of it:
SET maintenance_work_mem = '2GB';
What each operator class actually stores
This is the whole mechanism, and once you have it the rest is obvious.
jsonb_ops creates independent index items for each key and each value in the document. Your events payload has status, kind, amount, tags, actor, id, role, region as keys, plus every corresponding value, plus the array elements. That's roughly sixteen index entries per row, and the key status gets an entry in all two million rows.
jsonb_path_ops creates index items only for each value, hashed together with the path that leads to it. There is no standalone entry for the key status. There's a single hash covering "the path actor.region holds the value eu-west."
Two consequences fall out of that.
First, size. Roughly half the entries, and each one is a fixed-width hash rather than a variable-length key or value string.
Second, and this is the one that bites in production: with jsonb_ops, a query for payload @> '{"status": "failed"}' extracts two search keys, status and failed. The status key matches every row in the table. GIN has to intersect a two-million-entry posting list with a five-hundred-thousand-entry one. With jsonb_path_ops there is exactly one search key, the hash of path+value, and its posting list is already the answer. The docs put it plainly: jsonb_path_ops is better at searches where a frequently-appearing key is involved, because the path is folded into the hash instead of being indexed independently.
The operator support table
Print this and stick it to the wall. It is the entire decision.
| Operator | Meaning | jsonb_ops (default) | jsonb_path_ops |
|---|---|---|---|
@> | contains | yes | yes |
@? | jsonpath exists (PG 12+) | yes | yes |
@@ | jsonpath predicate (PG 12+) | yes | yes |
? | key/element exists | yes | no |
?| | any of these keys exists | yes | no |
?& | all of these keys exist | yes | no |
<@ | is contained by | no | no |
Three things to internalise.
<@ is supported by neither. If your ORM emits payload <@ '{"status":"failed"}', you get a sequential scan no matter which GIN index you built. I've watched a team spend an afternoon on that one. Rewrite it as @> from the other direction, or eat the scan.
The existence family is jsonb_ops only. WHERE payload ? 'deleted_at' is the query shape that forces your hand.
@? and @@ arrived in PostgreSQL 12. For a jsonpath query to actually be accelerated, the path expression has to reduce to accessor-chain-equals-constant form, like $.actor.region == "eu-west". Fancier predicates get evaluated by rechecking rather than served from the index, so the index narrows candidates and the executor does the rest.
Measuring it: size, build time, and EXPLAIN (ANALYZE, BUFFERS)
SELECT indexrelname,
       pg_size_pretty(pg_relation_size(indexrelid)) AS size
FROM   pg_stat_user_indexes
WHERE  relname = 'events'
ORDER  BY pg_relation_size(indexrelid) DESC;
On my 2M-row table:
      indexrelname       |  size
-------------------------+--------
 events_payload_gin_ops  | 412 MB
 events_payload_gin_path | 176 MB
 events_pkey             | 43 MB
Build times were about 88 seconds and 51 seconds respectively with maintenance_work_mem at 2GB.
Now the plans. Always use BUFFERS, and always run the query twice, because the first run is measuring your storage, not your index.
EXPLAIN (ANALYZE, BUFFERS)
SELECT count(*) FROM events
WHERE payload @> '{"actor": {"region": "eu-west"}}';
With the default jsonb_ops index:
 Aggregate  (cost=... rows=1 width=8) (actual time=1184.902..1184.903 rows=1 loops=1)
   Buffers: shared hit=31204
   ->  Bitmap Heap Scan on events  (actual time=241.7..1102.4 rows=666667 loops=1)
         Recheck Cond: (payload @> '{"actor": {"region": "eu-west"}}'::jsonb)
         Heap Blocks: exact=27891
         Buffers: shared hit=31204
         ->  Bitmap Index Scan on events_payload_gin_ops
               (actual time=238.1..238.1 rows=666667 loops=1)
               Index Cond: (payload @> '{"actor": {"region": "eu-west"}}'::jsonb)
               Buffers: shared hit=3313
 Execution Time: 1185.4 ms
With jsonb_path_ops:
 Aggregate  (cost=... rows=1 width=8) (actual time=982.3..982.3 rows=1 loops=1)
   Buffers: shared hit=28619
   ->  Bitmap Heap Scan on events  (actual time=64.2..903.9 rows=666667 loops=1)
         Recheck Cond: (payload @> '{"actor": {"region": "eu-west"}}'::jsonb)
         Rows Removed by Index Recheck: 3
         Heap Blocks: exact=27891
         Buffers: shared hit=28619
         ->  Bitmap Index Scan on events_payload_gin_path
               (actual time=61.0..61.0 rows=666670 loops=1)
               Index Cond: (payload @> '{"actor": {"region": "eu-west"}}'::jsonb)
               Buffers: shared hit=728
 Execution Time: 982.8 ms
Two things to read here.
The Bitmap Index Scan is where the win is: 3313 buffers versus 728, 238ms versus 61ms. The heap work afterwards is identical, because both indexes point at the same rows. If your query returns a third of the table, index choice matters less than you'd like. On a selective predicate the gap dominates the whole plan.
The shape is always Bitmap Index Scan → Bitmap Heap Scan with a Recheck Cond. GIN searches produce a bitmap, so you will never see a plain Index Scan on a JSONB GIN index. Stop looking for one.
And Rows Removed by Index Recheck: 3 is the jsonb_path_ops tax. Because it stores a hash of path+value, distinct path/value pairs can collide. Postgres handles it by rechecking the actual heap tuple and discarding false matches. Nothing to tune here; three rows out of six hundred thousand is just noise. Still, keep an eye on that number. If it climbs into double digits as a percentage of returned rows, something about your value distribution is hashing poorly, and it's worth comparing against a jsonb_ops plan for that specific query shape (which isn't recheck-free either, but fails differently).
Where jsonb_path_ops quietly loses
Three failure modes, all worth knowing before you commit.
No existence operators. Already covered, but it's the one that actually forces jsonb_ops. WHERE payload ?& array['gdpr_flag','consent_ts'] has no jsonb_path_ops answer.
Empty structures aren't indexed. jsonb_path_ops creates entries only for values. A structure containing no values, like {"a": {}}, produces no index entry at all. Searching for documents containing it requires a full scan of the index, which is exactly as slow as it sounds. I've seen this bite teams using empty objects as feature-flag scaffolding or draft-record placeholders — and it's easy to miss in testing, because your dev dataset probably doesn't have enough empty objects to notice. If your payloads legitimately carry empty objects or arrays as meaningful states, and you query for them, this is a real problem.
Hash collisions cause rechecks. Cheap in practice, but on a very wide payload with a very unselective predicate, or a value distribution that hashes poorly, the recheck cost is real and worth measuring rather than assuming away.
The practical rule I use: if any of those three describe your workload, either use jsonb_ops or, better, model the offending case as a proper column.
The third option nobody reaches for: a B-tree on an expression
Half the JSONB GIN indexes I've deleted should have been this:
CREATE INDEX events_status_btree
  ON events ((payload->>'status'));

ANALYZE events;
Note the double parentheses. Postgres requires them around an expression index unless the expression is already a function call.
This gives you four things no GIN index on a jsonb column can give you: equality, range predicates, ORDER BY, and unique constraints. A GIN index serves none of those — GIN has no concept of ordering. WHERE payload->>'created_month' BETWEEN '2026-01' AND '2026-03' ORDER BY payload->>'created_month' is a B-tree query, full stop.
The bigger win is statistics. ANALYZE collects statistics on the values of index expressions. Without the expression index, the planner has no idea how selective payload->>'status' = 'failed' is and falls back to a guess. With it, you get a real histogram and real MCVs for that expression, which fixes join order and row estimates far downstream of the index itself. That's frequently the actual reason a plan improves — a bad nested loop turning into a sane hash join further up the query.
Partial expression indexes are the sharpest version:
CREATE INDEX events_failed_recent
  ON events (created_at DESC)
  WHERE payload->>'status' = 'failed';
If 5% of rows are failures and that's all your dashboard queries, this index is a twentieth the size of anything else discussed here.
The maintainable variant, if you're on PostgreSQL 12 or later, is a stored generated column:
ALTER TABLE events
  ADD COLUMN status text
  GENERATED ALWAYS AS (payload->>'status') STORED;

CREATE INDEX ON events (status);
Now it's an ordinary typed column with ordinary statistics, and application queries read status instead of digging into JSON. Costs you disk, saves you arguments. (If you're on PostgreSQL 14+, payload['status'] is shorthand for payload->'status' via subscripting — cosmetic, same underlying operator, doesn't change any of the above.)
The caveat on all expression indexes: the expression is evaluated for every insert and every qualifying update, so they cost more to maintain than a plain column index. It's a real but usually modest tax against the read-side win for a hot filter column.
Multi-tenant filtering: btree_gin and the composite trick
Nearly every JSONB table I see is multi-tenant, and nearly every query looks like:
SELECT * FROM events
WHERE tenant_id = 42
  AND payload @> '{"status": "failed"}';
With separate indexes on tenant_id and payload, you get a BitmapAnd: two index scans, two bitmaps, an intersection. Workable, wasteful.
CREATE EXTENSION IF NOT EXISTS btree_gin;

CREATE INDEX events_tenant_payload
  ON events USING gin (tenant_id, payload jsonb_path_ops);
btree_gin supplies GIN operator classes for standard scalar types, which lets a single multicolumn GIN index combine tenant_id with the jsonb column. One index scan, tenant predicate applied inside the index. On a fifty-tenant table this cut my bitmap scan time by roughly two-thirds. For a schema where every query is tenant-scoped — which is most multi-tenant schemas — this is usually a bigger single win than agonizing over jsonb_ops versus jsonb_path_ops.
The operational bill: what GIN costs you on writes
Nobody mentions these until production hurts.
No index-only scans. GIN doesn't support them, ever. Even if every column your query needs is theoretically covered, Postgres still visits the heap to return column values. Adding columns to "cover" a GIN index accomplishes nothing.
HOT updates die. An UPDATE that modifies an indexed column cannot be a heap-only tuple update. Index a payload column that gets updated on every row touch, and every one of those updates now writes new index entries in every index on the table, not just the GIN one. Write amplification and bloat follow. If your JSONB column is a mutable state blob rather than an append-only event record, think hard before indexing it at all. A generated column indexed with a B-tree has the same problem, so the real fix is to stop updating the hot key inside JSON.
Fastupdate and the pending list. GIN has a fastupdate mechanism, on by default, that buffers new entries in an unordered pending list and merges them into the main structure later. Inserts get faster. Queries get slower while the list is large, because every search has to scan the pending list linearly. And when the list is flushed, whichever unlucky backend triggers it eats the merge cost, which shows up as a periodic latency spike on an otherwise flat p99, rather than a smooth, consistent write cost.
The levers:
-- kill the buffering entirely: steadier latency, slower inserts
ALTER INDEX events_payload_gin_path SET (fastupdate = off);

-- or keep it, but flush more often in smaller chunks
ALTER INDEX events_payload_gin_path SET (gin_pending_list_limit = '512kB');
gin_pending_list_limit also exists as a GUC and defaults to 4MB. My rule: bulk-load-then-query tables keep fastupdate on; OLTP tables with strict latency budgets get fastupdate = off. If you can't turn it off, shrink the limit so the spikes are smaller and more frequent, and schedule a VACUUM to do the merging on your terms rather than a user's.
Containment traps that produce wrong results
@> is structural and not depth-agnostic. This surprises people:
SELECT '{"a": {"b": 1}}'::jsonb @> '{"b": 1}'::jsonb; -- false
{"b":1} is not contained by {"a":{"b":1}} because containment only matches at the same nesting level — it does not search recursively. To find a key at any depth, you need jsonpath:
SELECT count(*) FROM events
WHERE payload @? '$.** ? (@.region == "eu-west")';
That's correct but recursive descent won't reduce to the accessor-chain-equals-constant form the index can extract, so expect recheck-heavy execution. Use it for ad-hoc investigation, not for a hot path.
Three more:
SELECT '{"a":1}'::jsonb @> '{}'::jsonb;      -- true: everything contains {}
SELECT '[1,2,3]'::jsonb @> '[3,1]'::jsonb;   -- true: order and duplicates ignored
SELECT '[1]'::jsonb @> '1'::jsonb;           -- true: special-case scalar exception
The first one matters if you build containment predicates from user input. An empty filter object matches every row. The second is usually what you want for tag-set matching, but will surprise you if you expected positional semantics.
My default playbook
- Start with
jsonb_path_ops. Not the default. Type the operator class. - Profile the top three JSONB predicates. Any of them filtering on a single key with equality, ranges, or sorting gets promoted to an expression B-tree, or a stored generated column plus a B-tree if the query is permanent.
- Reach for
jsonb_opsonly when you've confirmed you actually need?,?|, or?&— not "might need someday," actually need, today, in a query you can show me. Then ask whether that key should be a real column instead. - Multi-tenant? Install
btree_ginand puttenant_idin the GIN index. - Decide fastupdate deliberately per index. Don't leave it on by accident on a latency-sensitive table.
- Once a month:
SELECT indexrelname, idx_scan,
       pg_size_pretty(pg_relation_size(indexrelid))
FROM   pg_stat_user_indexes
WHERE  relname = 'events'
ORDER  BY idx_scan;
idx_scan at zero after a full business cycle means the index is pure write overhead. Drop it. JSONB GIN indexes are cheap to add and easy to forget about — that's exactly how schemas end up with three overlapping indexes on the same column, none of which anyone remembers choosing, each one costing HOT updates, pending-list flushes, and backup time for nothing.