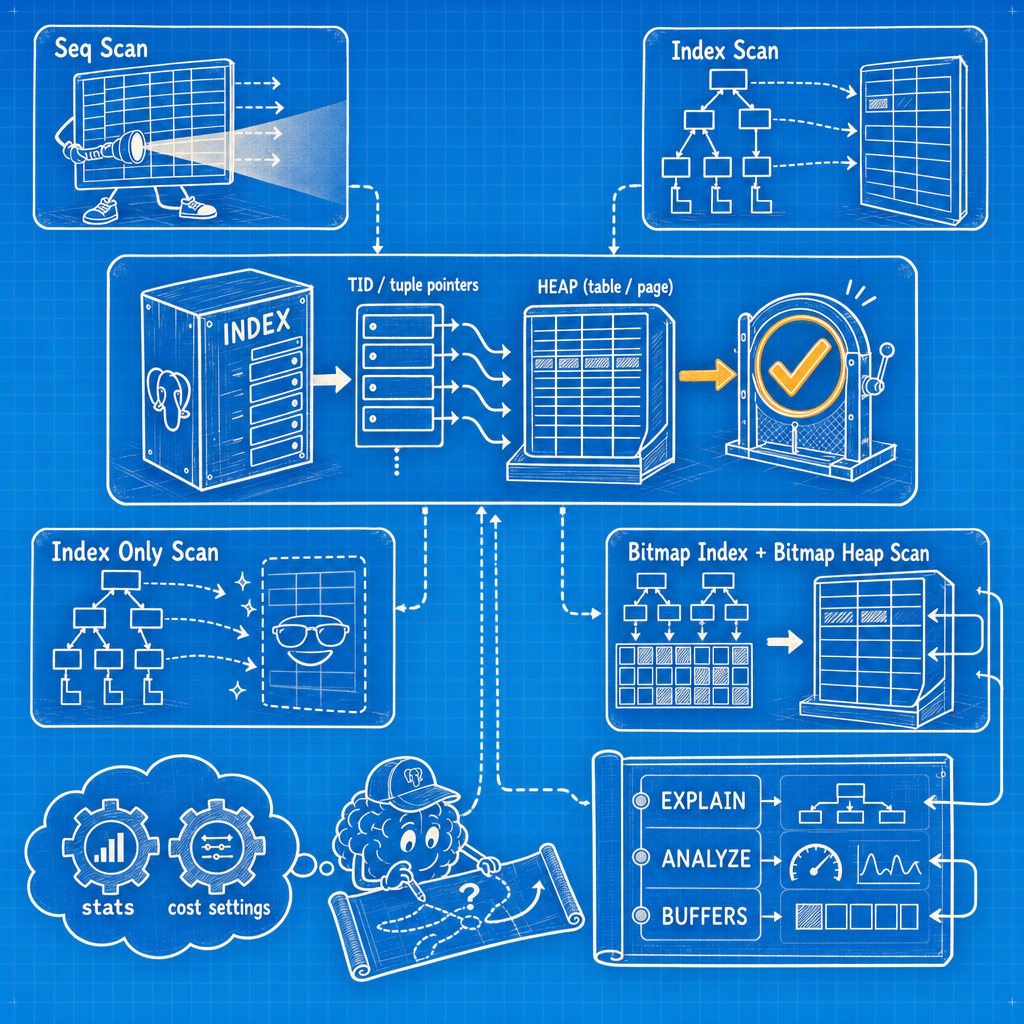
Most "slow query" problems come down to one question: is Postgres using an index, and if so, the right kind. Here's how the planner actually decides, and how to check it yourself instead of trusting gut instinct.
The B-Tree Is the Default for a Reason
When you run CREATE INDEX with no method specified, Postgres builds a B-tree. It's the default because it handles the widest range of queries well: equality, range comparisons (<, >, BETWEEN), sorting, and IN lists on ordered types. If you're not sure which index type you need, you probably need a B-tree.
The column order in a multi-column B-tree matters more than people expect. The index is only efficient for filtering on the leading column, or the leading columns as a prefix. An index on (status, created_at) helps a query filtering on status alone, or on status and created_at together — but it won't help much if you're filtering on created_at alone.
How Postgres Decides Whether to Use an Index
The planner isn't reading your intentions — it's estimating cost. For every query, it compares the estimated cost of a sequential scan against the estimated cost of an index scan (or bitmap scan), based on:
- Table and index statistics from
pg_stats(updated byANALYZE) - Estimated selectivity — how many rows match your condition
random_page_costandseq_page_costsettings- Whether the needed columns can be satisfied from the index alone
If a query returns a large fraction of the table, a sequential scan is often genuinely cheaper than jumping around an index. This is correct behavior, not a bug, even though it feels wrong when you were expecting an index scan.
Stale Statistics Break This Silently
If you've just done a big bulk insert or delete and haven't run ANALYZE, the planner is working from outdated row estimates. This is one of the most common reasons an index that should be used isn't. Run ANALYZE on the table and re-check before you touch the index definition.
Index Scan vs. Bitmap Heap Scan
Both use an index, but they behave differently:
- Index Scan: Postgres walks the index and fetches each matching row from the heap immediately, in index order. Efficient when few rows match.
- Bitmap Heap Scan: Postgres first builds a bitmap of matching page locations from the index, then visits the heap in physical page order. This avoids random I/O when many rows match, at the cost of losing sort order and needing a second pass.
You'll typically see Postgres switch from a plain index scan to a bitmap index scan + bitmap heap scan as the estimated number of matching rows grows. If you see Bitmap Heap Scan in your plan, it's not a failure — it's the planner reducing random disk access for a moderately selective query.
Index-Only Scans and the Visibility Map
An index-only scan skips the heap entirely — if every column the query needs is present in the index. This is the fastest path available, but it depends on the visibility map: Postgres still needs to confirm each row is visible to your transaction, and it can only skip the heap check for pages marked "all visible."
This is why you'll sometimes see Heap Fetches: 40000 on an otherwise index-only scan in EXPLAIN ANALYZE output. A high heap fetch count usually means the table has a lot of recent updates or deletes and hasn't been vacuumed enough for the visibility map to be current. Running VACUUM (not just ANALYZE) on the table often brings that number down dramatically.
Reading EXPLAIN (ANALYZE, BUFFERS)
EXPLAIN alone shows estimates. EXPLAIN ANALYZE actually runs the query and shows real row counts and timing. Add BUFFERS and you get shared hit/read counts — a much more stable signal than milliseconds, which vary with cache state and system load.
What to look for, in order:
- Rows Removed by Filter — a large number here means the index got you to roughly the right rows, but a non-indexed condition is still doing heavy lifting afterward.
- Buffers: shared hit vs. read — high
readcounts mean data is coming from disk, not cache. This is often the real cost, not the row count. - Actual rows vs. estimated rows — a big mismatch is a statistics problem, not an indexing problem.
When Postgres Refuses to Use Your Index
If you built an index and the planner still won't touch it, check these before assuming something is broken:
- The predicate isn't sargable. Wrapping the column in a function (
WHERE lower(email) = ...) or casting it prevents a plain index from being used — you likely need an expression index. - The table is small. For a table with a few hundred rows, a sequential scan is often faster than an index scan, and the planner knows it.
- Statistics are stale. Covered above — run
ANALYZE. random_page_costis set too high for your storage. On SSD-backed instances, the default of 4 overstates random I/O cost relative to sequential; lowering it (commonly to 1.1–2) can shift the planner's math.- The query returns too large a fraction of the table for an index to be worthwhile at all.
If you're troubleshooting this on a live production database and want a faster way to run and read these plans without switching tools constantly, something like MyDBA can help — but the diagnosis itself is always the same process: look at the plan, not the query.
What to Do Tomorrow
Take your slowest query. Run EXPLAIN (ANALYZE, BUFFERS). Find the node with the largest Rows Removed by Filter or the largest buffer count. Ask whether the condition on that node could become an Index Cond instead of a Filter, and whether the leading column of a candidate index would be an equality predicate. Build it concurrently, rerun the plan, and compare buffers rather than milliseconds.
If the plan doesn't change, the planner is telling you something. Believe it, check your statistics and random_page_cost, and drop the index you just built.