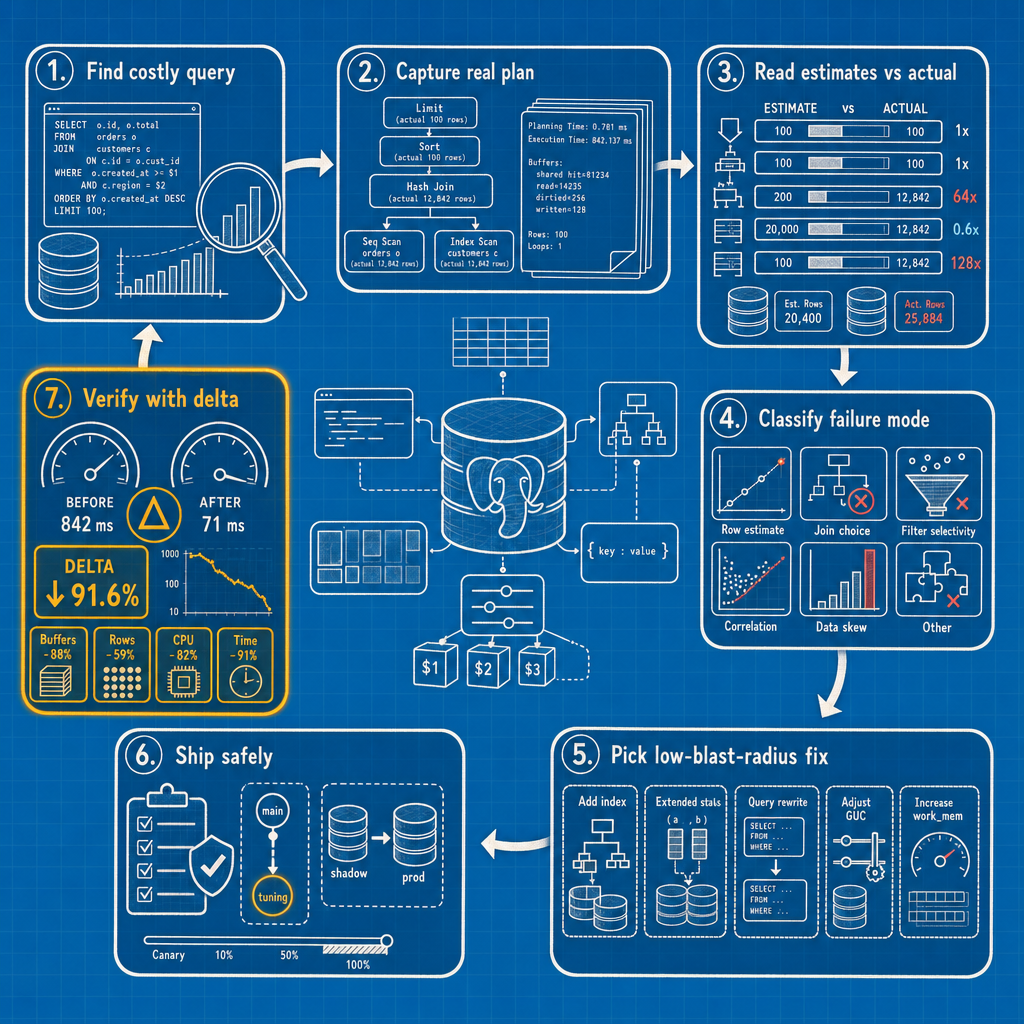
Postgres query performance tuning is a loop, not a one-off fix: rank the slow queries in pg_stat_statements, capture the real plan with EXPLAIN (ANALYZE, BUFFERS), work out why the row estimate is wrong, apply the smallest fix that closes the gap, then verify against production numbers before you call it done. This is the back half of that loop — fixing a bad estimate, indexing correctly, shipping without downtime, and proving the change actually helped.
Fixing a wrong row estimate
CREATE STATISTICS orders_wh_status_channel (dependencies, mcv)
  ON warehouse_id, status, channel FROM orders;
ANALYZE orders;
Re-run the plan after that alone: the orders scan estimate jumps from 3,281 to 46,140, the planner drops the nested loop in favor of a hash join against order_lines, and execution falls to 2.4 seconds. Better. Still bad. We're still pulling 1.18 million rows out of orders_placed_at_idx and throwing away 96% of them.
So, the index. Equality columns first, range column last. A btree can only use one range predicate as a stopping condition, and everything after it in the key order stops being useful for seeking:
CREATE INDEX CONCURRENTLY orders_wh_status_channel_placed_idx
  ON orders (warehouse_id, status, channel, placed_at);
With that in place the scan becomes an index scan with all four predicates as index conditions. Rows Removed by Filter disappears. The 41,120 block reads on orders fall to roughly 400.
Common mistakes to avoid
- No random GUC changes to fix one query. Doubling cluster-wide
work_membecause one report spills is how you get an OOM kill at 09:00 on Monday. Set it in the session or on the reporting role. - No
enable_*flags in production.SET enable_nestloop = offis a diagnostic instrument. It tells you the planner would have chosen X if it could, which is useful information. Leave it on in an application role and every other query in that role now runs on a hobbled planner, and you won't remember you did it. - No index before you've read the buffers. If the plan shows a 92% buffer hit rate and no
Rows Removed by Filter, an index isn't your problem, and you've just added write amplification for nothing. - No tuning
random_page_costto fix a single plan. It defaults to 4.0 against aseq_page_costof 1.0, a ratio that models rotating disks. On SSDs, lowering it toward 1.1 is a reasonable cluster-wide decision, made deliberately, witheffective_cache_size(default 4 GB, allocates nothing, purely advisory to the planner) set to something resembling reality. That's a capacity exercise, not a query fix. - No trusting
mean_exec_timealone, and no trusting a hand-typedEXPLAINwith guessed literals. Ship nothing without a before/after number pulled frompg_stat_statementsto point at.
Step 6 — Ship it without taking the site down
CREATE INDEX CONCURRENTLY avoids the ACCESS EXCLUSIVE lock a plain CREATE INDEX takes. The cost is real: it scans the table twice, takes longer overall, and can't run inside a transaction block. That last point breaks most migration frameworks, which wrap everything in BEGIN.
If it fails partway (deadlock, cancelled session, disk full), it leaves an invalid index behind. Find it and clean it up before retrying:
SELECT c.relname
FROM pg_index i JOIN pg_class c ON c.oid = i.indexrelid
WHERE NOT i.indisvalid;

DROP INDEX CONCURRENTLY orders_wh_status_channel_placed_idx;
An invalid index is the worst of both worlds. It's still maintained on every write, and the planner won't touch it. Check for these after every failed migration.
Before any DDL, set a lock timeout in the same session:
SET lock_timeout = '3s';
SET statement_timeout = '30min';
lock_timeout aborts a statement that waits too long to acquire a lock. Without it, your brief lock request queues behind a long-running transaction, and because lock requests queue in order, every subsequent query on that table piles up behind you. That's the classic self-inflicted outage during a "safe" migration. Three seconds, fail, retry in a minute.
Two more habits before you add an index. Check you aren't duplicating one that already exists with the same leading columns, and check total index size against table size, because every extra index costs you on write throughput and hands vacuum more work. And when you replace an index, don't drop the old one the same day. Watch idx_scan in pg_stat_user_indexes for a full traffic cycle first:
SELECT indexrelname, idx_scan, last_idx_scan,
       pg_size_pretty(pg_relation_size(indexrelid)) AS size
FROM pg_stat_user_indexes
WHERE relname = 'orders'
ORDER BY idx_scan;
idx_scan counts scans started on the index and is the standard basis for finding unused ones. PostgreSQL 16 added last_idx_scan and last_seq_scan timestamps, which turns "this counter hasn't moved since the last stats reset, I think" into an actual date.
Step 7 — Verify in production, with numbers
This is the step that separates a DBA from someone who added an index. A faster plan in psql proves nothing about aggregate load.
Snapshot the view before you deploy:
CREATE TABLE dba_pgss_snapshot AS
SELECT now() AS taken_at, * FROM pg_stat_statements;
Then, after a comparable window with comparable traffic, compare:
SELECT s.queryid,
       b.calls AS calls_before,
       a.calls - b.calls AS calls_after,
       round((b.total_exec_time / 1000)::numeric, 1) AS total_s_before,
       round(((a.total_exec_time - b.total_exec_time) / 1000)::numeric, 1) AS total_s_after,
       round(b.mean_exec_time::numeric, 2) AS mean_before,
       round(((a.total_exec_time - b.total_exec_time)
              / NULLIF(a.calls - b.calls, 0))::numeric, 2) AS mean_after,
       b.shared_blks_read AS reads_before,
       a.shared_blks_read - b.shared_blks_read AS reads_after
FROM pg_stat_statements a
JOIN dba_pgss_snapshot b USING (queryid, userid, dbid)
JOIN (SELECT 1) s(queryid) ON true
ORDER BY (b.total_exec_time - (a.total_exec_time - b.total_exec_time)) DESC
LIMIT 25;
Two things make this valid. The windows must be equal in length and comparable in traffic shape, which is why calls_before and calls_after are in the output, and why comparing a Tuesday afternoon to a Sunday morning is worthless. And nothing may have called pg_stat_statements_reset() in between, which you confirm from the stats_reset timestamp in pg_stat_statements_info. If you'd rather reset than snapshot, record that timestamp yourself.
For our query, over matched six-hour windows:
| before | after | |
|---|---|---|
| calls | 412 | 437 |
| total_exec_time | 3,782 s | 88.4 s |
| mean_exec_time | 9,181 ms | 202 ms |
| shared_blks_read | 38.8 M | 1.7 M |
Then check three more things, because a local win can be a global loss:
- Did cluster-wide buffer reads go down or up? Sum
shared_blks_readacross the whole view for both windows. A new index means new blocks competing for shared buffers. - Did any neighbouring query regress? Sort the delta ascending instead of descending. Writes to
ordersnow maintain one more index. If theINSERT INTO ordersentry grew by more than the report saved, you lost. - Is the new index actually being used?
idx_scanonorders_wh_status_channel_placed_idxmust be incrementing. If it's zero after a full cycle, the planner never picked it and you're paying maintenance cost for nothing.
Set the rollback trigger before you ship, not after. If total_exec_time for that queryid hasn't improved within one full traffic cycle (a day for most OLTP workloads, a week if the query only runs on batch schedules), drop the index and go back to step 3. Having decided that in advance is what stops you from defending a change out of sunk cost.
When to stop tuning
Some queries are slow because the question is expensive, not because the plan is bad. A top-50-by-revenue report across a quarter of a large orders table has to touch a quarter of a large orders table. You can get it from nine seconds to two hundred milliseconds with statistics and an index, which is what we did. Getting it to twenty milliseconds would require a summary table, and a summary table is a new thing to keep correct, backfill, and monitor.
My rule of thumb: if the third fix in a row buys less than a 2x improvement, the query has stopped being a tuning problem. The remaining options are architectural. Cache the result. Build a materialised view and refresh it on a schedule the business agrees to. Or tell the product team this report is a batch job, which is often true and occasionally welcome.
The other reason to stop is that indexes are not free. Every one you add slows down inserts and updates on that table, enlarges your backups, and hands autovacuum more index pages to clean. I've turned down index requests because the table already carried six indexes and the write path was starting to show it. A composite index that shaves 500ms off one report but adds measurable latency to a hot insert path, plus more vacuum churn on a high-write table, is not automatically a win. I've also seen a table with fourteen indexes where four had idx_scan = 0 since the last restart. That cluster's write latency improved more from dropping indexes than from any index anyone had ever added to it. Tuning has diminishing returns. The fifth index you add rarely pays for itself the way the first one did, and at some point the right answer is to stop touching the schema and go fix the query that's asking for too much.
The one-page checklist
A postgres query optimization workflow you can run under pressure, start to finish:
Step 1 — Rank
SELECT queryid, calls, total_exec_time, mean_exec_time,
       rows / GREATEST(calls,1) AS rows_per_call,
       shared_blks_hit, shared_blks_read, query
FROM pg_stat_statements
ORDER BY total_exec_time DESC LIMIT 20;
Check stddev_exec_time for bimodality. There are no percentiles in this view.
Step 1b — Rule out waits
Sample pg_stat_activity for wait_event_type. Lock means the plan is not your problem. On 16+, check pg_stat_io.
Step 2 — Capture the real plan
auto_explain via session_preload_libraries on the app role, log_min_duration set, log_timing = off, sample_rate low. Reproduce with EXPLAIN (ANALYZE, BUFFERS, SETTINGS) inside BEGIN; ... ROLLBACK;. On 16+, use GENERIC_PLAN for prepared statements. On 17+, add SERIALIZE when node times don't sum to wall clock.
Step 3 — Read three numbers
- First node bottom-up where estimate/actual blows out. That's the cause.
- Multiply
rowsbyloops. Multiplyactual timebyloops. shared hitvsread, in 8 kB blocks. ReadRows Removed by FilterandHeap Fetches.
Step 4 — Classify
Stale stats · correlated columns · missing/wrong-order index · non-sargable predicate · work_mem spill · LIMIT early-stop trap · generic plan · JIT on an overestimate.
Step 5 — Smallest fix first
ANALYZE → statistics target → CREATE STATISTICS → rewrite predicate → index → session-scoped GUC → plan_cache_mode → restructure → summary table.
Step 6 — Ship safely
SET lock_timeout = '3s';
SET statement_timeout = '30min';
CREATE INDEX CONCURRENTLY ...;   -- not inside a transaction block
-- then:
SELECT c.relname FROM pg_index i JOIN pg_class c ON c.oid = i.indexrelid
WHERE NOT i.indisvalid;
Invalid index after a failure: DROP INDEX CONCURRENTLY <name>; then retry.
Step 7 — Verify
Snapshot pg_stat_statements before. Compare total_exec_time and shared_blks_read for the queryid over equal windows with comparable calls. Confirm cluster-wide reads didn't rise, no neighbour regressed, and idx_scan on the new index is moving. Rollback trigger: one full traffic cycle, no improvement, drop it.
The loop is boring on purpose. Boring is what makes it repeatable at 3 a.m., and repeatable is the only thing that turns postgres slow query troubleshooting from a talent into a skill. If you'd rather have someone run this loop for you, that's the whole premise behind MyDBA.