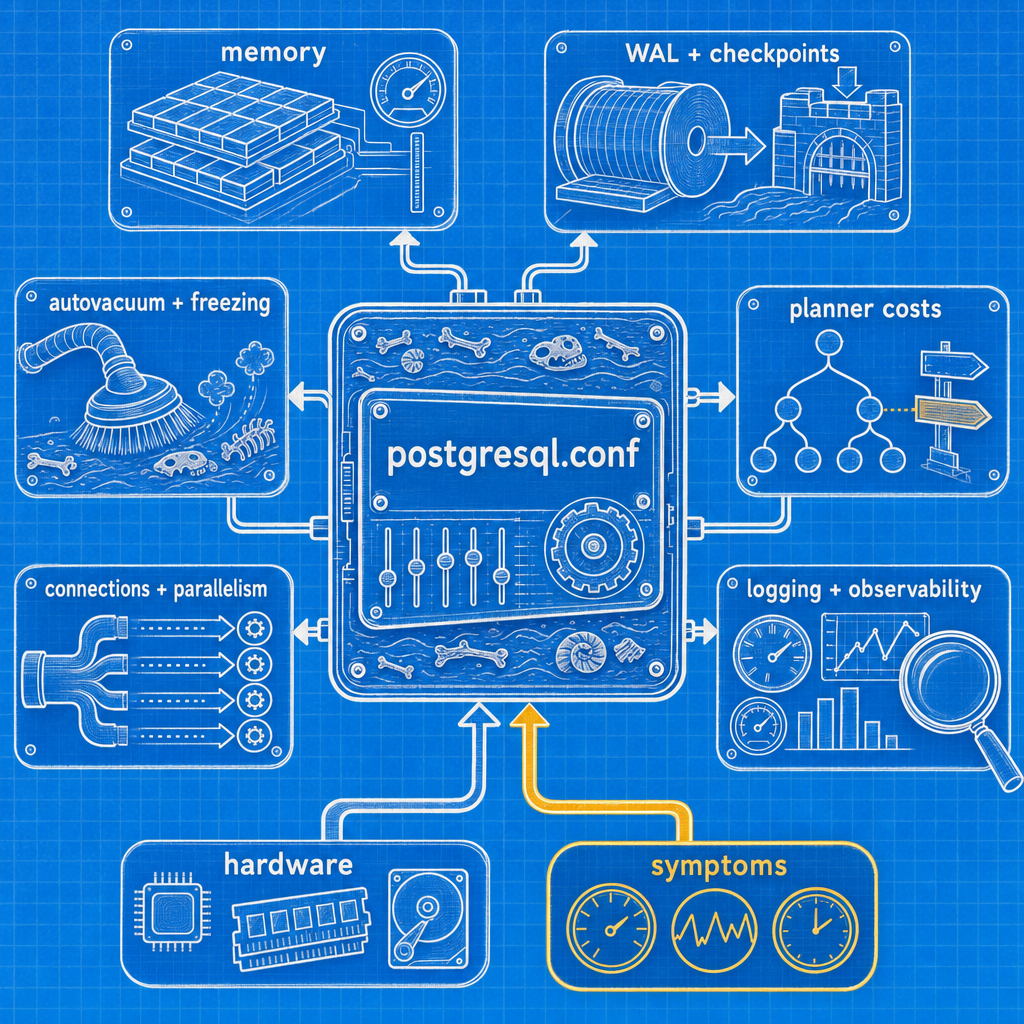
Most postgresql.conf files aren't tuned, they're accreted — one line added during every incident for the last five years, none ever removed. Below is what a production config actually needs, what changes for analytical workloads, and, just as important, what to leave at default so you're not fighting your own settings six months from now.
Core postgresql.conf settings for production
This is the baseline I start from on an OLTP system with real concurrency. Adjust shared_buffers and work_mem to your hardware and connection count, but the shape of the file should look like this.
# ---- Vacuum / freeze ----
vacuum_freeze_min_age = 5000000         # freeze early and incrementally on big tables
autovacuum_freeze_max_age = 200000000   # default; monitor age(datfrozenxid) against it

# ---- Logging ----
shared_preload_libraries = 'pg_stat_statements,auto_explain'   # [restart] non-negotiable
log_min_duration_statement = 500ms      # default -1 logs nothing, ever
log_checkpoints = on                    # default since PG15
log_autovacuum_min_duration = 250ms     # tighten below the PG15 default while chasing bloat
log_lock_waits = on                     # uses deadlock_timeout; nearly free contention data
log_temp_files = 0                      # your work_mem feedback loop
log_line_prefix = '%m [%p] %q%u@%d %a %h '
track_io_timing = on                    # validate with pg_test_timing first
deadlock_timeout = 1s                   # default; doubles as the lock-wait log threshold
auto_explain.log_min_duration = '3s'
auto_explain.log_analyze = on
auto_explain.sample_rate = 0.1

# ---- Guardrails (set per role, not globally) ----
# ALTER ROLE app_web SET statement_timeout = '5s';
# ALTER ROLE app_batch SET statement_timeout = '30min';
What changes if this is a warehouse
Same hardware, analytical workload, and roughly six lines move:
work_mem = 256MB. Concurrency is low (maybe 8 to 12 real queries), so the worst case is bounded. Withhash_mem_multiplier = 2.0, a four-hash-node plan across three processes is about 3GB. Ten of those is 30GB, which is too much, so I'd also cap the reporting pool at 6 connections in PgBouncer and treat that as the real limit.max_parallel_workers_per_gather = 4,max_parallel_workers = 8. Fewer, bigger queries want the cores.jit = on. Long queries genuinely benefit from compiled expression evaluation, andjit_above_cost = 100000stops it firing on trivia.maintenance_work_mem = 4GB. Bulk index rebuilds after loads.default_statistics_target = 250. Planning time matters less when queries run for minutes, and better estimates on wide joins pay for themselves.max_wal_size = 32GB,checkpoint_timeout = 30min. Loads write in bursts; let the checkpointer spread them.random_page_coststays close to 1.1, maybe 2.0 if cold partitions still lean on slower network-attached storage. Storage decides this, not the workload label.
Settings I leave at default, deliberately
An honest config has fewer lines than people expect. Here's what I don't touch, and why.
seq_page_cost = 1.0. It's the denominator. Tune the ratio by moving random_page_cost, and everyone reading your config after you will understand what you meant.
cpu_tuple_cost, cpu_index_tuple_cost, cpu_operator_cost. I have never had a production problem that these fixed and that better statistics didn't fix more durably. Changing them shifts every plan in the cluster to solve one query.
bgwriter_*. The background writer matters far less than the checkpointer on modern hardware. If pg_stat_bgwriter (or pg_stat_checkpointer on 17+) shows a large share of buffers written by backends relative to the checkpointer, look at shared_buffers and checkpoint tuning first.
commit_delay and commit_siblings. Group commit tuning needs a measured fsync bottleneck and a stable workload. I've hit that twice in a decade.
default_statistics_target = 100. Global is the wrong lever. Per column is the right one.
wal_buffers = -1. Let it auto-size off shared_buffers. I've never seen a workload where overriding it moved the needle versus sizing shared_buffers correctly first.
temp_buffers = 8MB. Only matters if you build large temp tables, and if you do, set it in that session.
autovacuum_vacuum_scale_factor globally. This one surprises people, given everything I wrote above about autovacuum defaults being too loose. I leave the global value at default and fix the specific tables. Twenty hot tables with explicit storage parameters is a documented, reviewable decision. A global 0.01 is a blunt instrument that makes autovacuum thrash across thousands of small tables that were perfectly fine.
max_connections above 300. If I'm tempted, the answer is a pooler, not a bigger number.
Settings you should almost never touch
fsync. Off means irrecoverable corruption after a crash or power loss, not just lost transactions. Only ever acceptable for throwaway data.full_page_writes. Off means torn pages on crash recovery. Some storage layers claim atomic 8kB writes; verify that claim to the level of the physical device before you believe it, and then still leave it on. If WAL volume is the actual complaint, fix checkpoint frequency instead of removing the protection.zero_damaged_pages. This makes Postgres silently discard corrupt pages instead of erroring. It's a forensic recovery tool you enable in a single session, with a backup taken first, under supervision. It is not a configuration setting.ignore_checksum_failure. Same category. It converts "I have detectable corruption" into "I have undetectable corruption."autovacuum = off. People do this to stop vacuum load and then get an anti-wraparound vacuum anyway, at the worst possible moment, on a table 400GB larger than it needed to be.
How to change configuration without breaking things
The mechanics of a safe change matter more than the values.
Baseline before you touch anything. Snapshot pg_stat_statements, pg_stat_database, pg_stat_bgwriter (or pg_stat_checkpointer on 17+), and note the p95 latency your application actually reports, along with checkpoint frequency and temp-file rate. If you can't tell whether the change helped, you didn't change anything, you gambled.
One variable at a time. Yes, this is slow. It's also the only way to know that the improvement came from random_page_cost and not from the deploy that shipped an hour later. Batching six changes into one restart is how config files become sediment in the first place.
Version control the fragments. include_dir = 'conf.d' with numbered files in git, deployed by your config management tool, with allow_alter_system = off on PostgreSQL 17+ so nothing drifts. When somebody asks why max_wal_size is 4GB, the answer should be a commit message with a link to the incident, not a shrug. Mixing ALTER SYSTEM and file-based config without discipline is exactly how you end up with the shadowed-duplicate problem pg_file_settings was built to catch.
Use ALTER SYSTEM for temporary changes only, and clean up after. ALTER SYSTEM SET log_min_duration_statement = '10ms' during an investigation, then ALTER SYSTEM RESET log_min_duration_statement when you're done. If it's permanent, it goes in the repo.
Validate before reload. Edit the file, query pg_file_settings for NOT applied OR error IS NOT NULL, then SELECT pg_reload_conf(), then re-run the pg_settings query from earlier and confirm pending_restart is what you expect.
Review on a cadence tied to data growth, not the calendar. A config sized for a 200GB database is wrong at 2TB, and the parameters that go wrong first are predictable: autovacuum thresholds on the tables that grew, max_wal_size as write volume climbed, work_mem as query shapes changed, maintenance_work_mem as indexes got bigger. Revisit these at round-number milestones for your largest tables — 100M rows, 500M rows, 1B rows — not on a schedule tied to the calendar. I re-derive the autovacuum arithmetic for the top twenty tables by size every time the database doubles. It takes twenty minutes and it has never once found nothing.
The whole discipline reduces to a habit: for every non-default line in your file, you should be able to name the symptom that put it there and the metric that would tell you to change it back. Any line that fails that test is exactly the archaeology this guide started with — sediment you'll be digging through at 2 a.m., left by someone who was solving today's problem without writing down what the problem was.
If you'd rather have this analysis run automatically against your own instance, MyDBA checks your live postgresql.conf against workload patterns and flags exactly this kind of unexplained drift.